One of the most widely used tools for tracking data about user behaviour on the web is Google Analytics. However, Google announced the end of one of the tools for collecting and evaluating data.
Universal Analytics ends on July 1, 2023, and will be replaced by a newer version of the tool for implementing analytics on the web – Google Analytics 4 (GA4). At the same time, GA4 represents the next generation of Analytics, which collects event-based data from websites and applications.
What are the differences between GA4 and UA?
The most crucial difference that we want to emphasise is the limited use time of Universal Analytics. As of July 1, 2023, UA will stop processing data. The tool that continues to offer the possibility to collect and evaluate data is Google Analytics 4 (GA4)
From March 2023, Google will automatically create ownership in GA4 for those users who have not yet started it or have not opted out of this option. The new GA4 thus automatically takes over the settings of your original UA and copies all unfinished configurations as audiences or targets – unless you have opted out of this option. After June 1, 2023, data processed in UA will be available for another six months. Therefore, export all essential historical reports before access to them ceases after the announced 6-month period.
Google Analytics 4 will make it possible to combine data from multiple sources.
Data about user behaviour on the web and simultaneously in the mobile application environment is combined into one interface, which gives a unified view of user behaviour across different platforms. In comparison, Universal Analytics only supports web pages.

Event-based data model
Google Analytics 4 uses a different way of tracking activity. Therefore, GA4 is based on events and parameters and is an event-based data model. An event is, therefore, any user interaction with the page. These Events offer a much more detailed view of user behaviour on the web or in applications. In comparison, Universal Analytics is based on sessions (session-based) and page views (Pageviews). Therefore, in addition to recommended and automatically collected Events, creating your own in GA4 is possible. Setting events is also possible in the Google Analytics 4 interface, but you must also use Google Tag Manager.
Google Signals
Google signals are a new option that will make it easier to track user activity across different devices. The data is grouped based on the events collected from the user signed in to the Google account, making the results more relevant. In comparison, this is possible only in Universal Analytics based on the created User ID, a permanent identifier for logged-in users. Therefore, Sites that do not have a login section perceive the activity of the same user from two different devices in duplicate.
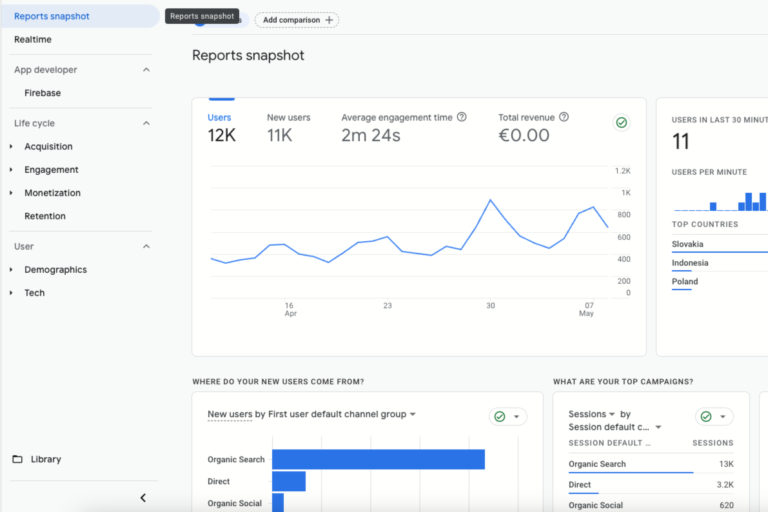
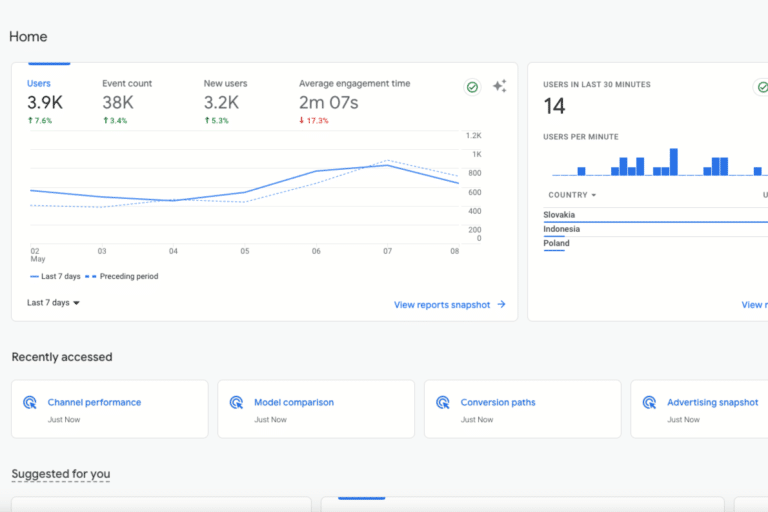
New navigation
The change from the previous UA model is the interface itself and the new navigation view. In addition, simplified sorting into clear categories and focusing mainly on collecting data from events brings the possibility to work with data more efficiently and compare, for example, data collected from different devices or countries.
Enhanced Measurements
Enhanced Measurements are events tracked using an improved measurement. In Google Analytics 4, when setting up a web data stream, it is possible to use event tracking using advanced measurement. Advanced measurement provides the opportunity to get as much information as possible about user interactions directly in the GA4 interface. Moreover, the setting is possible without developer intervention now in the sleeper – in the data streams – web section. This function automatically defaults, tracking events like Page_wiew, scroll, click – outbond: true, view_search_results, and file_download. In addition, you can set the events yourself and thus enable or disable them.
Selection of attribution model
The selection of attribution models was a missing part of Universal Analytics, where attribution models could be compared only in one already created report. As a result, GA4 users will appreciate the possibility of choosing which attribution model to use for comparison in standard reports.
Creating Audiences/Segments
Audience creation helps segment users based on set criteria that can be created, such as metrics and events. An audience created in this way can include different groups of users. In GA4, audience creation is more precise and shows the number of users included in the created rule. Analytics acquires and evaluates new data, thus ensuring that only users who still meet the set criteria remain in the made audience. Alternatively, in GA4, it is possible to determine how many days you want to have users included in the given audience.
Custom conversions in GA4
In GA4, it is possible to track predefined conversions for mobile applications:
First_open, In_app_purchase, App_store_subscription_convert, App_store_subscription_renew and Purchase conversion are also for websites. Another option is to track your conversions – by marking an already tracked event as a conversion, which is the easiest way to set up conversion tracking. You can find an event marked this way displayed in the conversion report.
For events you are not tracking yet and want to create a conversion from them, create a new event using the “new conversion event” option and enter the name of the event you wish to track as a conversion.
Funnel exploration
Creating funnels is a simple way to analyse user interactions that lead to conversions. Interactions represent events such as adding to the cart or entering the cart. You can choose, for example, the type of device on which the visitor visited the website or demographics into the segment, and you can easily compare user behaviour according to the selected criteria. The advantage is the visualisation of data and the creation of new features.
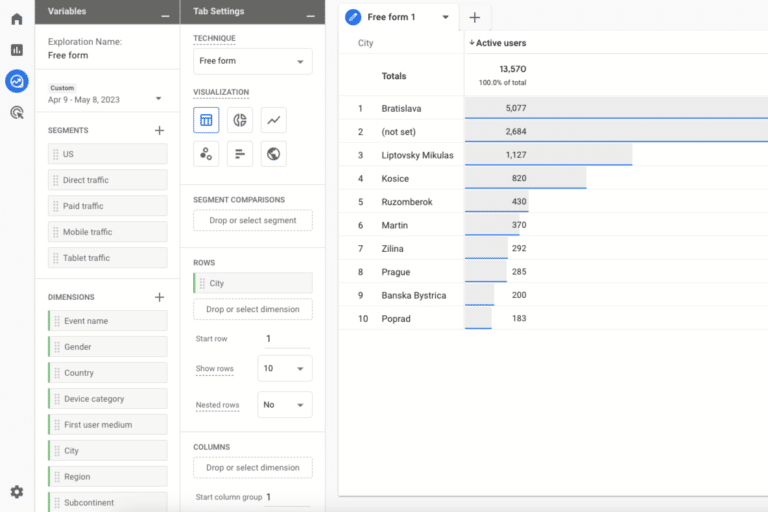
Free form exploration
In other words, surveys in free format offer the possibility of your choice in the configuration and visualisation of data in a table or graph, according to your preferences. In this way, it is possible to compare several metrics and use, for example, filters or segments. GA4 offers many options, thanks to which it is possible to quickly and easily visualise data and effectively search for connections better than standard reports.
How to get started with GA4?
1. Log in to your Google Analytics account or create one.
2. select the account you want to follow in the Administrator or Admin section or create a new account.
3. Create a new property, fill in the data and confirm the Data Stream creation- your data source will flow to GA4. (Type: web. For mobile applications, programmer intervention in the source code is required). The data stream must have its source created, to which a unique identifier is assigned.
4. Enter your website’s URL and the stream’s name and create – Create stream.
5. Leave Enhance Measurement on, and data will be collected automatically. Primary events will be measured on your website; you can add more to them – for example, recommended events.
6. Now that you have created a new Data stream with your name, copy the Measurement ID and open Google Tag Manager or choose another option to implement GA4 on the website, for example, by directly embedding it in the source code.
PRO TIP:
If you haven’t started with Google Analytics 4 yet, be sure to do so as soon as possible. Data you collected in Universal Analytics after 1.7. 2023 will not be lost, but they will remain available only for viewing for another six months. After that, managing new ones will not be possible, which would mean stopping analytics in an environment where GA4 is not implemented yet. If you want to help with the implementation of GA4, write to us.
Previous topic
How to use social
media videos...
Next topic
How to use social
media videos...